This post is about the FFT function, and anyone wants to know how to specify the frequencies for plot the values.
A few of theory:
If your signal has N values [0, N - 1], then the Fourier Transform has N distinct values.
The function fft(.) returns the signal in the interval [0, N - 1], so you can use the function fftshift(.), over the function fft(.) like this: X = fftshift(fft(x)), that it returns the Fourier Transform in the intervals:
- [-(N - 1)/2, (N - 1)/2], if N is odd.
- [-N/2, N/2 - 1], if N is even.
About the frequencies, if your signal was sampled with a rate T (T samples by second), the indexes are given multiplying the interval by: 2*%pi*T.
Look the example:
N = 100;
n = 1:N;
T = 0.1; // one sample by each 0.1s
w = 0.5; // frequency of the sampled signal (in radians)
x = cos(w*n);
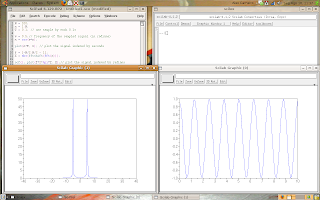
plot(n*T, x); // plot the signal indexed by seconds
f = [-N/2:N/2 - 1];
X = fftshift(fft(x));
scf();
plot(f*2*%pi*T, X); // plot the signal indexed by radians
The result is:

Observing that w = 0.5 is the frequency of the sampled signal, the true frequency (of the analog source signal) is given by w_source = w/T = 0.5/0.1 = 5 rad/s. Now, click on the image and look where the peaks are.
6 comments:
Hi!!
Could you also elaborate on what do the amplitude of these peaks signify or to put it in simpler language, what does the yaxis stand for?
Short answer: The Y axis is signal amplitude * N/2.
Long answer:
This relates to the whole chunk of theory behind the Fourier transform. FFT (or fast fourier transform) merely refers to a computational algorithm to compute the DFT (Discrete Fourier Transform) of a digitally represented signal.
In a nutshell, Mr. Fourier has demonstrated that any mathematical function can be represented as a sum of sines of different frequencies and time relationship (phase).
The output of the FFT plot represents the frequency(s) present in the signal analyzed on the X axis, and the magnitude (amplitude) of the additive component at that frequency.
So on to your question, "what does the y axis mean?" It's 50, and we would expect it to be "1". This is amplitude*N/2. This could be normalized by dividing by N/2.
Here is a bit that I modified from one of the help manual examples. It demonstrates a normalized plot showing only the positive X-axis, and if you play with the input signal amplitudes, it will be reflected 1 for 1 on the frequency plot. This also displays frequency in Hz, not radians.
//Frequency components of a signal
//----------------------------------
// build a noides signal sampled at 1000hz containing to pure frequencies
// at 50 and 70 Hz
sample_rate=1000;
t = 0:1/sample_rate:0.6;
N=size(t,'*'); //number of samples
s=sin(2*%pi*50*t)+ 0.3*sin(2*%pi*70*t+%pi/4)+ 0.2*grand(1,N,'nor',0,1);
y=fft(s);
//the fft response is symetric we retain only the first N/2 points
f=sample_rate*(0:(N/2))/N; //associated frequency vector
n=size(f,'*')
yy = y*2/N;
clf()
plot2d(f,abs(yy(1:n)))
Hi...
Can anyone tell me how to do the discrete fourier transform of a function using Scilab?
In that case, I think that w_source is not w/T, but w*n*T.
cmiiw.
Olá Alex,
Estou plotando dois gráficos a partir da fft de dois sinais na forma plot2d3 (raias apenas). Quero multiplicar raia a raia e obter um terceiro gráfico (resultado). No entanto, noto que ao tratar os dois sinais inicias com janela de Hamming os valores de pico se alteram nos 2 primeiros gráficos e consequentemente no resultado. Entendo que o janelamento seria apenas para minimizar as bordas dos sinais originais para minimizar ruídos. Sabe porque esta alteração ocorre e como corrigí-la? Obrigado.
Oi André, infelizmente não sei como posso ajudá-lo.
Todavia, veja se não é feita alguma ponderação no janelamento, semelhante ao que ocorre quando implementamos a operação de convolução com diferentes núcleos (step, gaussian, exponencial).
Outra coisa, peço se você puder, para fazer os próximos comentários em inglês, pois assim conseguimos alcançar mais pessoas que podem ter as mesmas dúvidas.
Abraço e boa sorte com o desafio.
Post a Comment