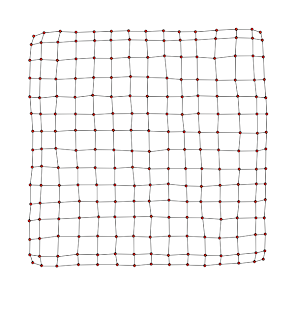
Following with our online Scilab's tutorial, let's learn how to make grids, like the figure:
 This type of graphs are very important for data visualization.
The first step is to define each point.
Look the example:
(1, 5) - (2, 5) - (3, 5) - (4, 5) - (5, 5)
(1, 4) - (2, 4) - (3, 4) - (4, 4) - (5, 4)
(1, 3) - (2, 3) - (3, 3) - (4, 3) - (5, 3)
(1, 2) - (2, 2) - (3, 2) - (4, 2) - (5, 2)
(1, 1) - (2, 1) - (3, 1) - (4, 1) - (5, 1)
The x-coordinates are the matrix:
X = [1, 2, 3, 4, 5;
1, 2, 3, 4, 5;
1, 2, 3, 4, 5;
1, 2, 3, 4, 5;
1, 2, 3, 4, 5]
And the y-coordinates are the matrix:
Y = [5, 5, 5, 5, 5;
4, 4, 4, 4, 4;
3, 3, 3, 3, 3;
2, 2, 2, 2, 2;
1, 1, 1, 1, 1]
So, we can use the meshgrid function, like presented in the following script:
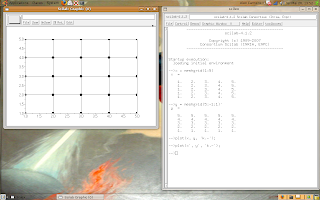
-->x = meshgrid(1:5)
x =
1. 2. 3. 4. 5.
1. 2. 3. 4. 5.
1. 2. 3. 4. 5.
1. 2. 3. 4. 5.
1. 2. 3. 4. 5.
-->y = meshgrid(5:-1:1)'
y =
5. 5. 5. 5. 5.
4. 4. 4. 4. 4.
3. 3. 3. 3. 3.
2. 2. 2. 2. 2.
1. 1. 1. 1. 1.
-->plot(x, y, 'k.-');
-->plot(x', y', 'k.-');
The result:

Now, I think it's interesting to upgrade our example.
Look the script:
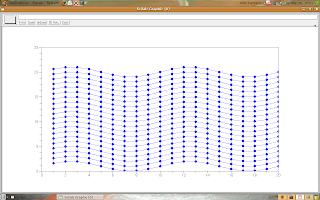
-->t = 1:20;
-->x = meshgrid(t);
-->y = meshgrid(t($:-1:1))';
-->w = %pi/5;
-->s = sin(w*x);
-->plot(x, s + y, 'b.-');
-->plot(x', (s + y)', 'b.-');
The result:

Try to change the grid and look what happens.
5 comments:
Thank you for the post. I appreciate that people like you are out there publishing information. This helped me to learn scilab better. Also, props to using an open source OS +1
I agree with the last comment, cheers!
And in the topic of learning.
What does the "$" at the line:
--> y = meshgrid(t($:-1:1))';
Thanks in advance.
Dear Filipe, the '$' indicates the end of the vector 't'.
In this case, 't($:-1:1)' is the inverse of 't', look following:
t = [t(1) t(2) ... t($)]
t($:-1:1) = [t($) t($ - 1) ... t(1)]
You can use the '$' like a number, for example:
if length(t) = n then length(t($/2)) = n/2 (for 'n' is even)
Thanks for your comment.
Dear Sheep.
Following your examples, could you tell me please how to give additional attributes to each node of the grid? I mean, for example, how to give a pair of attributes of each node (its mass and its electric charge, for example). Thanks a lot.
Luis Ángel (México)
Hi Luis, this post presents how to make grids like graphs, each data point has only position information ({x,y} coordinates). But if you need to add more information, you could only create more components for each point.
For example:
x_coordinates = ones(100, 1)*(1:100);
y_coordinates = (ones(100, 1)*(100:-1:1))';
q_electric = rand(100, 100);
w_mass = 10*rand(100, 100);
data(:,:,1) = x_coordinates;
data(:,:,2) = y_coordinates;
data(:,:,3) = q_electric;
data(:,:,4) = w_mass;
In the example, each point data(x,y,:) has four attributes: x and y coordinates, electric charge and mass, and you can upgrade it as you want to.
Regards
Post a Comment