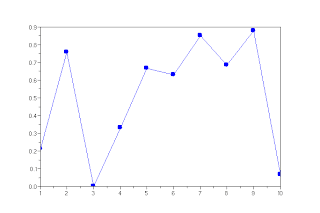
In this post, we will learn how to mark the points on the line's graphs, like the following figure.
 The possible styles of markers in Scilab are:
- Plus sign;
- Circle;
- Asterisk;
- Point;
- Cross;
- Square;
- Diamond;
- Upward-pointing triangle;
- Downward-pointing triangle;
- Rightward-pointing triangle;
- Leftward-pointing triangle;
- Five-pointed star (pentagram);
- No marker (default).
Let's do some examples:
-->x1 = rand(10, 1);
-->plot(x1, 'x');
-->plot(x1, 'o');
-->t = 1:10;
-->x2 = exp(-0.1*t);
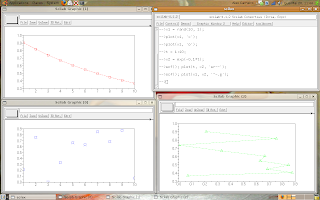
-->scf(); plot(t, x2, 'sr--');
-->scf(); plot(x1, x2, '^-.g');
The result:

Ok, now we are ready for start real applications.
1 comment:
Hai sheep,
I admire your desire to promote free software such as Scilab... Plus to teach people using it, that really takes a lot of spirit man.
It is really helpfull, especially to us students and independent researchers.
Thanks again brother. Look forward to learn fro your new post.
Post a Comment