That function is the simplest one for create graphs.
Let's learn something more about that function.
Try the commands:
-->x = rand(10, 1)
x =
0.2113249
0.7560439
0.0002211
0.3303271
0.6653811
0.6283918
0.8497452
0.6857310
0.8782165
0.0683740
-->plot(x);
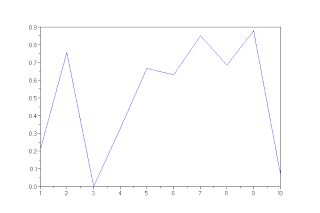
The result is the following picture.
 Look the indexes (x axis), it starts on 1 and finishes on 10, because we did not put the x axis in the plot(.).
An other case:
-->y = rand(10, 1)
y =
0.3076091
0.9329616
0.2146008
0.312642
0.3616361
0.2922267
0.5664249
0.4826472
0.3321719
0.5935095
-->x = [0 1 2 3 4 5 6 7 8 9]'
x =
0.
1.
2.
3.
4.
5.
6.
7.
8.
9.
-->plot(x, y);

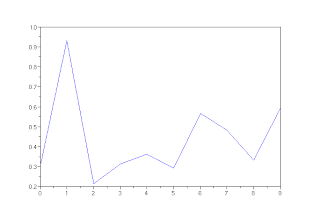
Now, the x axis starts on 0 and finishes on 9, because I put the coordinates of x axis.
No comments:
Post a Comment