Why do we need to do graphs? I think that's a unnecessary question.
The Scilab holds the last graph that we do.
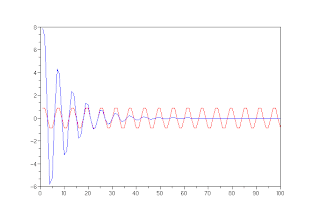
For example, if we need to do two graphs in a same screen, like the following figure.

Then we need to do the commands:
-->t = 1:100;
-->x1 = sin(t*%pi/3);
-->x2 = 10*exp(-0.1*t).*sin(t*%pi/3);
-->plot(x1, 'r');
-->plot(x2);
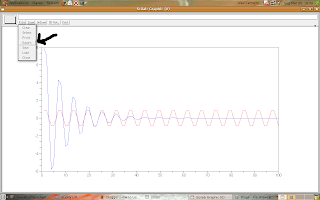
The showed graph needs to be saved, so we can click the option export (following figure), after we choose the format and the file's name.

All ready, the file is saved as a picture!
No comments:
Post a Comment