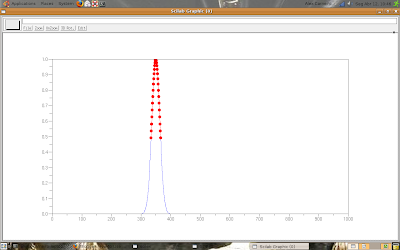
We developed a code for finding the FWHM of a given peak in a function, and now the code will be posted in this post.
function [fwhm_positions, fwhm_values] = fwhm(x, positions)
tp = positions; //assign the peak position into tp
t_aux = 1;
while x(tp) < 2*x(tp + t_aux),
t_aux = t_aux + 1;
end;
fwhm_positions = (tp - t_aux):(tp + t_aux);
fwhm_values = x((tp - t_aux):(tp + t_aux));
endfunction;
t = 1:1000;
m = 350;
s = 180;
x = exp(-(1/(2*s))*(t - m).^2); // 'x' is a gaussian function
plot(t, x);
plot(fwhm_positions, fwhm_values, 'r.-');
Now, look the result following.

Thanks CV, you helped us too much!
God bless you.
6 comments:
I copied the code into scilab editor, saved it and tried to execute it. It plots a gaussian, but yields an undefined variable for fwhm_positions here
plot(fwhm_positions, fwhm_values, 'r.-');
so the red dots don't plot. It looks as if the function does not execute. This is what I copied and tried to run. Also ran it from the console--same result
function [fwhm_positions, fwhm_values] = fwhm(x, positions)
tp = positions; //assign the peak position into tp
t_aux = 1;
while x(tp) < 2*x(tp + t_aux),
t_aux = t_aux + 1;
end;
fwhm_positions = (tp - t_aux):(tp + t_aux);
fwhm_values = x((tp - t_aux):(tp + t_aux));
endfunction;
t = 1:1000;
m = 350;
s = 180;
x = exp(-(1/(2*s))*(t - m).^2); // 'x' is a gaussian function
plot(t, x);
plot(fwhm_positions, fwhm_values, 'r.-');
What to do??
I validated that the function does not execute. After execution, variables after the endfunction can be validated from the console, but t_aux and tp are undefined.
Why does not the function execute?
Thanks
Hi Gery,
try it:
t = 1:1000;
m = 350;
s = 180;
x = exp(-(1/(2*s))*(t - m).^2); // 'x' is a gaussian function
plot(t, x);
[fwhm_positions, fwhm_values] = fwhm(x, m);
plot(fwhm_positions, fwhm_values, 'r.-');
After 'endfunction'
Thanks for your contribution.
Well, I tried it as suggested and get the same error. I copy the suggested code from the web page into the scilab editor, save it, and execute it.
in console we see
-->exec('/fwhmtest.sce', -1)
plot(fwhm_positions, fwhm_values, 'r.-');
!--error 4
Undefined variable: fwhm_positions
at line 19 of exec file called by :
exec('/fwhmtest.sce', -1)
Obviously, you don't get this result. I don't see any error in what I am doing, but the result is non-positive.
My friend Gary, this is the full code:
function [fwhm_positions, fwhm_values] = fwhm(x, positions)
tp = positions; //assign the peak position into tp
t_aux = 1;
while x(tp) < 2*x(tp + t_aux),
t_aux = t_aux + 1;
end;
fwhm_positions = (tp - t_aux):(tp + t_aux);
fwhm_values = x((tp - t_aux):(tp + t_aux));
endfunction;
t = 1:1000;
m = 350;
s = 180;
x = exp(-(1/(2*s))*(t - m).^2); // 'x' is a gaussian function
plot(t, x);
[fwhm_positions, fwhm_values] = fwhm(x, m);
plot(fwhm_positions, fwhm_values, 'r.-');
Try to execute the code using "ctrl + l", directly from the editor.
Thank you for your contribution, again.
See you.
Hi Sheep!
Thanks for sharing!
Post a Comment