In this semester, I'm teaching Artificial Intelligence discipline, and we are studying algorithms of classifying: Decision Trees and Neural Networks.
One important task of the discipline is to test the developed algorithm and estimate it accuracy. For that, I use to create artificial data which is controlled and simple to analyze.
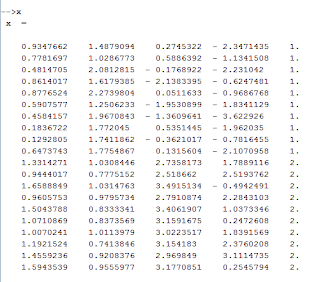
The data consists of one table of N columns and many rows (let's use M rows). N - 1 first ones columns are of input data and the last column means the label (target), like presented below.
The variable x presented is a matrix (table) with 5 columns and 20 rows. Being 4 columns of input data and the last column a label for each row.
Label data are in a subset of natural numbers {1, 2, 3, 4, ....}, in the presented case {1, 2} where 1 means one class and 2 means the other.
N - 1 first columns are created through rand() function using M/P rows for each class of data, with it we created a equal distributed data set for classes representativeness (P means how many classes are in the data set).
For the variable x presented, it was created like following.
-->n = 10;
-->x = [[rand(n, 1); rand(n, 1) + 0.9] [1 + 2*rand(n, 1); rand(n, 1)*0.5 + 0.65] [rand(n, 1, "normal"); rand(n, 1) + 2.5] [rand(n, 1, "normal") - 2; rand(n, 1, "normal") + 2] [ones(n, 1); 2*ones(n, 1)]];
But it's possible to use only simpler forms of combined columns for creating overlapped input data.
Once created the matrix, we can write it to a file:
-->write("my_data.txt", x);
And later we can read the data again to a variable:
-->y = read("my_data.txt", -1, N);
Take a look at
http://usingscilab.blogspot.com.br/2009/03/using-files.html
http://usingscilab.blogspot.com.br/2009/08/basic-statistic.html
http://usingscilab.blogspot.com.br/2011/02/statistics-operators-mean-and-stdev.html
http://usingscilab.blogspot.com.br/search/label/matrix
for more details.

No comments:
Post a Comment