Wednesday, December 24, 2014

Keyboard input in running time

MERRY CHRISTMAS!

Dear readers, I hope you have a merry Christmas and a great new year!

This is my last post in 2014, thus I'd like to say THANK YOU, for all my readers, this blog has been much visited and became a relevant reference for Scilab.

This blog is the concretization of my will to share some knowledge about Scilab, and it's now a reference for people around the World.

But, coming to the technical content, let's see something about using keyboard for input data in running time.

Scilab has the function input(), that holds the script execution and returns anything is typed in the keyboard.

Try this line in the Scilab console:

-->x = input("x will be: ");
x will be: 2

-->x
 x  =

    2.

The value 2 was inserted from the keyboard, you can try any value and after use the variable x in following commands.

If you want to input a string, there are two ways:

single or double quotes when typing:

-->x = input("x will be: ");
x will be: 'hi'

-->x
 x  =

 hi  

-->x = input("x will be: ");
x will be: "hello"

-->x
 x  =

 hello  


Or, you can use a second argument "string":

-->x = input("x will be: ", "string");
x will be: yes!

-->x
 x  =

 yes!


If you try to type text without single or double quotes, there will happen an error:

-->x = input("x will be: ");
x will be: test
Undefined variable: test
x will be: 0


So, it's all!

Let's stay using, studying and improving Scilab in 2015!

Wednesday, October 8, 2014

Native Function for Parsing String to Math Expression

My last post was about parsing strings to math functions, like:

parsingStr2Arithmetics("2+2")
 ans  =

    4.  

But, Scilab has a native function that evaluates strings:

evstr()

There are some examples using this function:

-->evstr("1")
 ans  =

    1.

-->evstr("1+1")
 ans  =

    2.

-->evstr("2*(1+8)/3")
 ans  =

    6.

-->evstr("2*(1+1)")
 ans  =

    4.

-->evstr("2*(1+1) a")
%val=[2*(1+1) a;
                !--error 4
Variável indefinida: a
in  execstr instruction    called by :
at line      35 of function evstr called by :
evstr("2*(1+1) a")


Take a look that last example ahs failed, it happened because the argument "2*(1+1) a" does not mean a valid expression.

Thus, there is a optimized way to do this task and work with strings which mean math expressions.

Another useful use for this function is to use it for running another functions, for example:

-->evstr("exp(1)")
 ans  =

    2.7182818

-->evstr("sin(%pi/2)")
 ans  =

    1.

-->evstr("zeros(5, 5)")
 ans  =

    0.    0.    0.    0.    0.
    0.    0.    0.    0.    0.
    0.    0.    0.    0.    0.
    0.    0.    0.    0.    0.
    0.    0.    0.    0.    0.

To put a string in the argument, there is needed to use an inside single quote ', like this:

-->"'"my string'""
 ans  =

 "my string"  


So, the function evstr() may evaluate strings with other strings inside, like this:

-->evstr("'"my'"+ '" string'"")
 ans  =

 my string  

-->evstr("length('"test'")")
 ans  =

    4.

-->evstr("strsplit('"this is a string inside'", '" '")")
 ans  =

!this    !
!        !
!is      !
!        !
!a       !
!        !
!string  !
!        !
!inside  !

Think out of the box, strings may mean math and any other functions or sentence!

Wednesday, November 6, 2013

Parsing string to math expression with inline function

This week, I discovered a new math game for Android: Match The Math (https://play.google.com/store/apps/details?id=com.engcross.matchthemath).

I have seen this app converts a string to a math expression and solves it in real-time. So I though about how doing it in Scilab, to get a string like "2*5 + 2" and return the number that corresponds to the result of the expression, in the example 12 (= 2*5 + 2).

Scilab has an interesting way to create "one line" functions, e. g. sum2numbers(a,b) where this function should return just a+b. This way is called inline functions and is defined like following:

deff('[x]=func(a,b)', 'x=a+b');

Where '[x]=func(a,b)' defines the structure of the function with x being the return, func is the name of the function and a and b are the arguments; 'x=a+b' is what the function executes when is called: x=a+b.

With this concept in mind, we can use a inline function to parse a string to a arithmetic expression because deff() uses only strings as arguments.

Let's use a common function definition, with a string to be parsed as argument, and one inline function inside:

function [x]=parsingStr2Arithmetics(s) // definition of the function
deff('[x]=f()', 'x='+s); // creates inline function that parses the string
x = f(); // calls the function to return it result
endfunction; //end of the function


Now our function is ready, we can test it using different expressions as arguments.

-->parsingStr2Arithmetics("2")
 ans  =

    2. 

-->parsingStr2Arithmetics("2+2")
 ans  =

    4. 

-->parsingStr2Arithmetics("2+2*5")
 ans  =

    12. 
-->parsingStr2Arithmetics("(2+2)*5")
 ans  =

    20. 

-->parsingStr2Arithmetics("(2+2)*5 - 3")
 ans  =

    17. 


For finishing this post, I recommend you to try Match The Math game, it's really cool and improves our math and problems solving skills.

Tuesday, October 8, 2013

Scilab as supporting software for mobile

In Eng Cross' blog we can see some apps those have Computer Vision features. I have known OpenCV, Open Computer Vision API, has a wrapper for Android, which is used by Eng Cross in his apps.

Nowadays, there are information about two apps:

4 Views

This app applies four different effects in camera's image and composes a new image where the user can select one effect to be applied to the image and save pictures in Pictures directory.


Right Angle

This app creates a "L" mark in the center of the screen and identifies any right angle aligned with the mark holding the screen and pointing the vertex of the angle.


But, what's the relation between these Android apps with Scilab?

Scilab has the toolbox SIVp (Scilab Image and Video Processing toolbox) that can be used for testing similar algorithms. Once developing codes in Scilab is much faster than in any programming language, it's very useful to use this simulation environment for making first tests and validations of advanced algorithms, like computer vision, image/signal processing, statistics analysis, math modeling, etc.

Added to being an simulation environment, Scilab can work as server for high intensive processing solutions, concentrating information, e. g. from sensors, and sharing data to mobile devices through webservices, like using JSON.

Wednesday, August 14, 2013

JSON in Scilab

Hi dears, today I've met a tool for Scilab that makes possible to handle JSON files into Scilab code. This tool is available through ATOMS or in http://forge.scilab.org/index.php/p/json/

Once installed, let's make a simple test with this tool just for validation.

First, it's created a json file (json_test.json) like below:

{
  "orderID": 12345,
  "softwareName": "Scilab",
  "ToolName": "JSon",
  "contents": [
    {
      "productID": 1,
      "productName": "Test1",
      "quantity": 1
    },
    {
      "productID": 2,
      "productName": "Test2",
      "quantity": 3
    }
  ],
  "demoCompleted": true
}


Now, it's needed to get this file into Scilab, what we can do uding mgetl(.) function:

json_test = mgetl("file_test.json");

Take attention for the path of the file.

And the function JSONParse(.) returns the struct that corresponds to the data in the file, like this:

mystruct = JSONParse(json_test)

The expected result is

-->mystruct
 mystruct  =

   orderID: 12345
   softwareName: "Scilab"
   ToolName: "JSon"
   contents: [1x2 struct]
   demoCompleted: "%T"


For accessing the fields, try this:

-->mystruct.orderID
 ans  =

    12345. 

-->mystruct.ToolName
 ans  =

 JSon  

-->mystruct.contents.productName
 ans  =


       ans(1)

 Test1  

       ans(2)

 Test2  


JSON is like XML pattern, much used for WebServices and in other Internet cases. Thus, I recommend to spend a few time taking a look about this technology and how Scilab can aggregate value to your solutions.

Monday, July 1, 2013

Plotting conical curves - circles

Conical curves are very known geometric spaces based on section of cones. There are four conical curves:
  • circle;
  • ellipse;
  • hyperbole;
  • parabola.

All of them are very used in computer graphics and, in this post, I wish to present how to plot a circle.

The analytic equation of circles is: (x - xc)² + (y - yc)² = r² where (xc, yc) means the center of the circle and r is it radius.

We know cos²(a) + sin²(a) = 1, for any angle a, thus multiplying both sides of equation by r² we obtain (r cos(a))² + (r sin(a))² = r².

Comparing original equation with obtained equation, it's possible to verify that:

x - xc = r cos (a)
x = r cos(a) + xc

y - yc = r sin(a)
y = r sin(a) + yc


So, we have now the values for x and y depending only of the center of the circle, it radius and an angle a.

(xc, yc) and r are given by the circle and a is an angle that means a dummy variable in range [0, 2*%pi].


Now, let's write some code in Scilab.

By first, a circle of radius r = 2 and center (xc, yc) = (0, 0).


//center of the circle
xc = 0;
yc = 0;

//radius of the circle
r = 2;

//dummy variable for angle in range [0, 2*%pi]
a = linspace(0, 2*%pi, 100);

//x axis
x = xc + r*cos(a);

//y axis
y = yc + r*sin(a);

//plot the circle
plot(x, y);


The result of this code is the following picture.

Take attention the limits of the circle are (-2, 2) both for x and y axis, what means this circle is centered in (0,0) with radius 2.


And for finishing, a harder example, four circles with different centers and radius.

/////////////////////////////////////////
//center of the circle
xc = 6;
yc = 0;

//radius of the circle
r = 6;

//dummy variable for angle in range [0, 2*%pi]
a = linspace(0, 2*%pi, 100);

//x axis
x = xc + r*cos(a);

//y axis
y = yc + r*sin(a);

//plot the circle
plot(x, y);

////////////////////////////////////////
//center of the circle
xc = 6;
yc = 0;

//radius of the circle
r = 2;

//dummy variable for angle in range [0, 2*%pi]
a = linspace(0, 2*%pi, 100);

//x axis
x = xc + r*cos(a);

//y axis
y = yc + r*sin(a);

//plot the circle
plot(x, y);

////////////////////////////////////////
//center of the circle
xc = 2;
yc = 0;

//radius of the circle
r = 2;

//dummy variable for angle in range [0, 2*%pi]
a = linspace(0, 2*%pi, 100);

//x axis
x = xc + r*cos(a);

//y axis
y = yc + r*sin(a);

//plot the circle
plot(x, y);

////////////////////////////////////////
//center of the circle
xc = -3;
yc = 3;

//radius of the circle
r = 3;

//dummy variable for angle in range [0, 2*%pi]
a = linspace(0, 2*%pi, 100);

//x axis
x = xc + r*cos(a);

//y axis
y = yc + r*sin(a);

//plot the circle
plot(x, y);

And the result is:


Take attention the parameters of center and radius of each circle and the obtained picture.

Tuesday, April 9, 2013

Analytical derivation with Scilab

Today, I have discovered one useful function in Scilab, the derivat() function that works with expressions like
which consists of functions of linear combinations with integer exponents of one variable (in the example denoted by z).

The function derivat() implements the analytical derivation of p(z), giving the following result:

We can create this kind of expression with Scilab function poly(), like this:
-->p1 = poly([1 -2 1], 'x', 'coef')
 p1  =

                   2 
    1 - 2x + x  

-->p2 = poly([1 -4 2], 'y', 'coef')
 p2  =

                     2 
    1 - 4y + 2y  

-->p3 = poly(ones(1, 10), 'z', 'coef')
 p3  =

                 2    3    4    5    6    7    8    9 
    1 + z + z + z + z + z + z + z + z + z   

-->p4 = poly([-1 1], 't', 'roots')
 p4  =

           2 
  - 1 + t

-->s = %s; p5 = s^{-1} + 2 + 3*s
 p5  =

                     2 
    1 + 2s + 3s  
    -----------  
           s       


And so on.


Now, the derivat() function implements the analytical derivation of the given functions:

-->derivat(p1)
 ans  =

  - 2 + 2x  

-->derivat(p2)
 ans  =

  - 4 + 4y  

-->derivat(p3)
 ans  =

                    2      3      4      5      6      7      8 
    1 + 2z + 3z + 4z + 5z + 6z + 7z + 8z + 9z  

-->derivat(p4)
 ans  =

    2t  

-->derivat(p5)
 ans  =

             2 
  - 1 + 3s  
    ------  
       2    
      s     


There is a way for applying your knowledge about linear systems with a powerful open source simulation tool.

Thursday, April 4, 2013

Creation of artifical data for classification tests

In this semester, I'm teaching Artificial Intelligence discipline, and we are studying algorithms of classifying: Decision Trees and Neural Networks.

One important task of the discipline is to test the developed algorithm and estimate it accuracy. For that, I use to create artificial data which is controlled and simple to analyze.

The data consists of one table of N columns and many rows (let's use M rows). N - 1 first ones columns are of input data and the last column means the label (target), like presented below.

The variable x presented is a matrix (table) with 5 columns and 20 rows. Being 4 columns of input data and the last column a label for each row.

Label data are in a subset of natural numbers {1, 2, 3, 4, ....}, in the presented case {1, 2} where 1 means one class and 2 means the other.

N - 1 first columns are created through rand() function using M/P rows for each class of data, with it we created a equal distributed data set for classes representativeness (P means how many classes are in the data set).

For the variable x presented, it was created like following.

-->n = 10;

-->x = [[rand(n, 1); rand(n, 1) + 0.9] [1 + 2*rand(n, 1); rand(n, 1)*0.5 + 0.65] [rand(n, 1, "normal"); rand(n, 1) + 2.5] [rand(n, 1, "normal") - 2; rand(n, 1, "normal") + 2] [ones(n, 1); 2*ones(n, 1)]];

But it's possible to use only simpler forms of combined columns for creating overlapped input data.

Once created the matrix, we can write it to a file:

-->write("my_data.txt", x);


And later we can read the data again to a variable:

-->y = read("my_data.txt", -1, N);

Take a look at

http://usingscilab.blogspot.com.br/2009/03/using-files.html

http://usingscilab.blogspot.com.br/2009/08/basic-statistic.html

http://usingscilab.blogspot.com.br/2011/02/statistics-operators-mean-and-stdev.html

http://usingscilab.blogspot.com.br/search/label/matrix

for more details.


Monday, February 4, 2013

2D Rotation

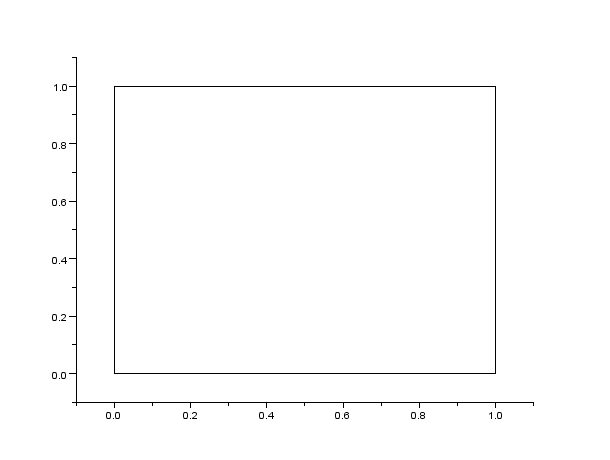
Let's make a rotation of a square. First, we create the square:

A = [0, 0];

B = [1, 0];

C = [1, 1];

D = [0, 1];

sq = [A;
      B;
      C;
      D;
      A];

plot2d(sq(:,1), sq(:,2), rect = [-.1 -.1 1.1 1.1]);

The result is the following picture.


For rotating this object an angle a = pi/4 (45°), we can do

a = %pi/4;

r = [cos(a) -sin(a);
     sin(a) cos(a)];

sq_r = sq*r;

plot2d(sq_r(:,1), sq_r(:,2));

 The result is


The same technique can be done for rotation any kind of geometric structure.

For another example, look a random structure and its rotation.

sq = rand(10, 2);

plot2d(sq(:,1), sq(:,2), rect = [-.1 -.1 1.1 1.1]);

a = %pi/4;

r = [cos(a) -sin(a);
     sin(a) cos(a)];

sq_r = sq*r;

plot2d(sq_r(:,1), sq_r(:,2), style = 2);


The result is

Take attention the presented rotation method rotates the object using the center of axes (point (0, 0)) as reference. However, it's very simple to change the point of reference just adjusting matrix r, can you do this?


Wednesday, January 23, 2013

Equalis Introduces Advanced Image and Video Processing Module - Equalis - Where Engineering and Science Computes

Equalis Introduces Advanced Image and Video Processing Module - Equalis - Where Engineering and Science Computes

This a very interesting new for engineers, students and researchers who work with image processing and/or computer vision, like me.

I hope to study something about this new module soon and I can support anyone else that intend to begin in this amazing area.

Happy year of 2013 for everyone!

Monday, November 26, 2012

Queue simulation in Scilab

This post is an answer for Agnes, who commented the last post:

Engineering and Scientific Computing with Scilab - Book

This script is a simple simulation of a queue of packs (or anything else) which there are a source, the queue and a destiny.

I coded this script for simulating and problem where there is a source that sends packs with a specific probability, a queue that receives the source packs and stores them, with a maximum number of stored packs, and a destiny that receives the packs from the queue with another specific probability.

All interested ones can run the code and comment it.

N_packs = 15; //total number of packs

P_send = 0.5; //probability of a pack to be sent

P_process = 0.5; //probability of a pack to be processed

N_queue = 10; //maximum number of elements in the queue

N_sent = 0; //number of packs sent to queue

N_line = 0; //number of packs in the queue

N_processed = 0; //number of packs processed

src = rand(N_packs, 2); //source packs

dst = []; //destiny packs

line = []; //queue

processed = []; //processed packs

while N_processed < N_packs,
    try
        plot(src(:,1) + N_queue + 2, src(:,2), '.g'); 
//plots source packs as green dots
    end;
    
    try
        plot(processed(:,1) + N_queue + 2, processed(:,2), '*k'); 
//plots the queue as line of blue dots
    end;
    
    plot(1:N_queue, zeros(1, N_queue), '.w'); //clears queue dots
    
    try
        plot(line(:,1), line(:,2), '.b'); 
//plots the queue as line of blue dots
    end;
    
    try
        plot(dst(:,1), dst(:,2), '.r'); 
//plots destiny packs as red dots
    end;
    
    if rand() < P_send then 
//sends a pack with P_send probability
        if and([N_line < N_queue N_sent < N_packs]) then 
//verifies the queue is full or all packs have been sent
            N_sent = N_sent + 1;
            
            N_line = N_line + 1;
            
            line(N_line,:) = [N_line 0];
            
            processed(N_sent,:) = src(1,:);
            
            src = src(2:$,:);
        end
    end
    
    if rand() < P_process then 
//processes a pack with P_process probability
        if N_line > 0 then 
//verifies the line has at least one pack
            N_processed = N_processed + 1;
            
            N_line = N_line - 1;
            
            line = line(1:N_line,:);
            
            dst(N_processed,:) = -rand(1, 2);
        end
    end
end

Friday, November 16, 2012

Engineering and Scientific Computing with Scilab - Book

I found this book today: Engineering and Scientific Computing with Scilab and there is a very good reference for Scilab users and engineers in general.

The beginning of the book has an introduction about Scilab software and how to use it. In Part II, the book contains information about a specific Systems and Control Toolbox for Scilab.

Part III presents Applications, and here we can apply all knowledge to create and model real systems for simulation and/or real-time control.

This kind of basis makes the difference in undergraduate studies, because the students can easily see and practice their theoretical concepts and improve their problems solving skills.

Using a simulation environment, students can safely test any system and see what happen in many cases and different situations.

So, everyone knows I'm a strong defender of simulations in engineering and all nature sciences, and a book like that is a great signal other people are investing time and work in the same ideal.

However, we must hold in mind, simulation is only the beginning, but it can cut off many problems, specially in design process.

Thursday, October 18, 2012

Scilab as software for engineers

I'm an engineer (of telecommunications) and have used Scilab for several years (since 2005). There are many useful tools for image and signal processing, optimization, linear systems and transformations, and general simulations.

Scilab is a software for numerical simulation supported by Scilab Consortium. This group of companies provides resources and services for users and other companies those intend to migrate to an open and stable software platform.

Beyond formal support, Scilab Consortium is an open environment for doubts and discussions where everyone can help and be helped.

About technical resources, Scilab has two ways for developing and application or simulation: script language (Scinotes) or drag-and-drop interface (Scicos), both are powerful but I believe script language is supported by more external toolboxes.

Scilab external toolboxes are freeware and can be downloaded and installed through ATOMS tool (see next picture, click in the figure to enlarge it).


Some links for posts I have published here about my fields of study:

Matrices: http://usingscilab.blogspot.com.br/search/label/matrix

Scilab functions: http://usingscilab.blogspot.com.br/search/label/functions

Fourier Transform: http://usingscilab.blogspot.com.br/search/label/fft

Signal processing: http://usingscilab.blogspot.com.br/search/label/signal%20processing

Image Processing: http://usingscilab.blogspot.com.br/search/label/image%20processing

Data visualization: http://usingscilab.blogspot.com.br/search/label/plot

Statistics: http://usingscilab.blogspot.com.br/search/label/statistic

Mathematics: http://usingscilab.blogspot.com.br/search/label/math


Tuesday, October 2, 2012

Plotting contours of surfaces

I know there is very useful to see contours of surfaces, many areas use this kind of resource and Scilab has a very simple way to do that.

For a first example, let's use the surface given by the function z = x² + y², this function is a 3D parable. Run the following code for making this surface's graph.


x = -5:0.1:5;
 y = -5:0.1:5;

[xx yy] = meshgrid(x, y);

z = xx.^2 + yy.^2;

plot3d(x, y, z);


The generated graph is like this.
Now, let's see the contours of that surface. But, before, it's interesting to analyze the equation z = x² + y². If z is fixed in a constant value, we have x² + y² = const and this equation means a circle centered in the point (0, 0) and radius square of const.

For plotting the contours, run this code:

n_curves = 10;
x = -5:0.1:5;
y = -5:0.1:5;

function z=my_surface(xx, yy),
z=xx^2 + yy^2;
endfunction

contour(x, y, my_surface, n_curves);


The result is presented following:

In fact, we can see there are concentric circles centered in the point (0, 0).

So, that's all folks!

Wednesday, September 19, 2012

Plot3d2: creating a cube

For creating a cube with plot3d2(.) function it's required to create three matrices for mapping each vertex of the cube.

Think the six faces of the cube, now open them on a plan and hold each vertex position of the cube. Empty elements of the matrix should be filled according spacial logic of the cube, with the same value of the neighbor vertexes.

-->x = [zeros(4, 2), ones(4, 2), zeros(4, 1)]
 x  =

    0.    0.    1.    1.    0. 
    0.    0.    1.    1.    0. 
    0.    0.    1.    1.    0. 
    0.    0.    1.    1.    0. 

-->y = ones(4, 5);

-->y(2:3,2:3) = 0
 y  =

    1.    1.    1.    1.    1. 
    1.    0.    0.    1.    1. 
    1.    0.    0.    1.    1. 
    1.    1.    1.    1.    1.  

-->z = [zeros(2, 5); ones(2, 5)];
 z  =

    0.    0.    0.    0.    0. 
    0.    0.    0.    0.    0. 
    1.    1.    1.    1.    1. 
    1.    1.    1.    1.    1. 

-->plot3d2(x, y, z);


Result is presented in the following image:
In this case, all faces of the cube are equal, which makes this structure symmetric.

Plot3D: rectangular surface

I received a request of how to create a rectangular surface.

This post is about plot3d(.) function, which I use to create surfaces in Scilab: http://usingscilab.blogspot.com.br/2009/06/plot-3d-surface.html

Now, look plot3d(.) has three arguments: x, y, and z, being the first two ones vectors and the last one is a matrix.

For a surface that x and y are in set [0, 10] and z is in set [0, 1], take the following code:

-->x = 0:10;

-->y = 0:10;

-->z = zeros(length(x), length(y)); // z matrix is initialized with zeros

-->z(($/4):(3*$/4),($/4):(3*$/4)) = 1 // a square in the matrix is set to 1
 z  =

    0.    0.    0.    0.    0.    0.    0.    0.    0.    0.    0. 
    0.    1.    1.    1.    1.    1.    1.    1.    0.    0.    0. 
    0.    1.    1.    1.    1.    1.    1.    1.    0.    0.    0. 
    0.    1.    1.    1.    1.    1.    1.    1.    0.    0.    0. 
    0.    1.    1.    1.    1.    1.    1.    1.    0.    0.    0. 
    0.    1.    1.    1.    1.    1.    1.    1.    0.    0.    0. 
    0.    1.    1.    1.    1.    1.    1.    1.    0.    0.    0. 
    0.    1.    1.    1.    1.    1.    1.    1.    0.    0.    0. 
    0.    0.    0.    0.    0.    0.    0.    0.    0.    0.    0. 
    0.    0.    0.    0.    0.    0.    0.    0.    0.    0.    0. 
    0.    0.    0.    0.    0.    0.    0.    0.    0.    0.    0. 

-->plot3d(x, y, z); // shows the 3d graphic with x, y, and z components


The generated image is the following.

I wish this example has been helpful.

Obs.: for creating a cube, or parallelogram, plot3d2(.) function is more recommended: http://usingscilab.blogspot.com.br/2012/09/plot3d2-creating-cube.html

Monday, September 3, 2012

Gamma function

Last week I was teaching about combinatorial analysis and talking about factorial operator I remembered Gamma Function, this function is very useful in signal processing but particularly Gamma Function is equal to the factorial for non-negative integer numbers.

Theory about Gamma Function is very well described in Wikipedia: http://en.wikipedia.org/wiki/Gamma_function

The equation that defines Gamma Function is


Following figure presents the graph of Gamma Function


And when z is a non-negative integer is verified that


This consequence is because of the property


Typical values of Gamma function are

 In Scilab, there are both functions: gamma(.) and factorial(.), following are some examples of these functions


-->factorial(1)
 ans  =

    1. 

-->gamma(1)
 ans  =

    1. 

-->factorial(1.5)
 !--error 10000
factorial: Wrong value for input argument #1: Scalar/vector/matrix/hypermatrix of positive integers expected.
at line      14 of function factorial called by : 
factorial(1.5)


-->gamma(1.5)
 ans  =

    0.8862269 

-->sqrt(%pi)/2
 ans  =

    0.8862269 

Look factorial(.) is not possible to be applied in a non-integer number, the same happens with negative numbers.

And gamma(.) in 1.5 is equal to sqrt(%pi)/2 verifying the correspondence presented in the typical values figure.


Obs.: all equations and figures that I posted in this text were got from the Wikipedia page.

Friday, May 25, 2012

Scilab Tips

This week I discovered Equalis has a portal for Scilab users shared tips and examples of applications: http://www.equalis.com/blogpost/731635/Scilab-Tips

It's a suggestion for improving Scilab community integration because there are users of everywhere, and if you need anything about Scilab, I believe Equalis portal is the place where you can find anyone that can help you.

Another useful way for using Equalis portal is to make yourself more visible in Scilab community, probably you know something that is the solution for a doubt of other Scilab user.

Wednesday, November 2, 2011

The highest number

It's known Scilab works as a calculator, displaying results of math operations.

I was trying to obtain the highest number that Scilab can work with, so it's what I found:

-->1.7976931348623158079999999999999999999999999999999999999e+308
 ans  =

    1.79D+308 

-->1.797693134862315808e+308
 ans  =

    Inf

It's a great number! And I think this number can attend all our needs for computations and operations.

Wednesday, October 12, 2011

Simulating physical events through computer graphics techniques - rectilinear motion

Hi everyone, unfortunately my time is not being enough for making posts as I'd like to do.

Let me share my situation: I'm working at morning and afternoon in a company and giving classes at night in a university.

So, all days of my weeks are full of activities and studies. I wish to set my time better on the following days, because I like to make posts on my blogs and share something of what I know.

In this post, I want to teach how to simulate a physical event using computer graphics techniques, just a comment: one of my disciplines in the university is computer graphics and we are using Scilab for the examples and exercises.

Let's try to simulate some kinematics events, about rectilinear motions.

For a first example, being a punctual object that's moving over a horizontal line (on the floor) and we wish to see this moving event by a top vision.


The movement equation is

position = initial_position + velocity * time_variation


Now, writing the code:


initial_position = [0; 0]; //point that refers to initial position meaning [x_initial_coordinate; y_initial_coordinate]


velocity = [1; 2]; //vector velocity meaning [x_velocity_component; y_velocity_component]


time = [0:10]; //instants that we will create samples for showing on the screen


position = initial_position*ones(1, length(time)) + velocity*time; //this command implements the movement equation, and the matrix ones(1, length(time)) is used for correcting the dimensions and makes the matrices sum possible


for t = 1:length(time), //this loop creates the graph dynamically simulating real motion
 plot(position(1,[1:t]), position(2,[1:t]), '.y'); 
 plot(position(1,t), position(2,t), '.');
 sleep(1000);
end;


This code will show the last point of position with blue color and the other points with yellow color.


Test the code and send me feedback of your feelings.