I received an e-mail with a question like this: how to make three graphs using plot3d(.) function, and each graph's color is different?
So, let's try it:
//limits on 'x' axis
X1 = 20;
X2 = 30;
X3 = 50;
//limits on 'y' axis
Y1 = 25;
Y2 = 50;
Y3 = 80;
//variables 'x' and 'y', for each function
[y1, x1] = meshgrid([1:Y1]', [1:X1]');
[y2, x2] = meshgrid([1:Y2]', [1:X2]');
[y3, x3] = meshgrid([1:Y3]', [1:X3]');
//functions
w1 = %pi/6;
z1 = sin(w1*(x1 + y1));
w2 = %pi/10;
z2 = cos(w2*(x2 - y2)) + 5;
z3 = tanh(x3 - y3) + 10;
//conversion for plot3d(.)
[xx1, yy1, zz1] = genfac3d(1:X1, 1:Y1, z1);
[xx2, yy2, zz2] = genfac3d(1:X2, 1:Y2, z2);
[xx3, yy3, zz3] = genfac3d(1:X3, 1:Y3, z3);
//making graphs on the same screen
plot3d(xx1, yy1, list(zz1, color("red")*ones(1, max(size(zz1)))));
plot3d(xx2, yy2, list(zz2, color("green")*ones(1, max(size(zz2)))));
plot3d(xx3, yy3, list(zz3, color("blue")*ones(1, max(size(zz3)))));
Or, if you prefer, you can use:
//same of the three last lines
plot3d([xx1 xx2 xx3], [yy1 yy2 yy3], list([zz1 zz2 zz3], [color("red")*ones(1, max(size(zz1))) color("green")*ones(1, max(size(zz2))) color("blue")*ones(1, max(size(zz3)))]));
Now, see the result:
So, it's all. Any question?
Scilab is a software of scientific simulation. It can operate with vectors, matrices, images, state space, and other kinds of situations. I've been working with Scilab since 2005, and I always have success in my projects using Scilab.
Tuesday, April 13, 2010
Monday, April 12, 2010
Full width at half maximum
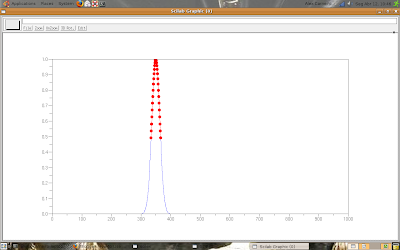
Hi everyone, I have a new reader and we talked about Full Width at Half Maximum - FWHM here (in the comments).
We developed a code for finding the FWHM of a given peak in a function, and now the code will be posted in this post.
function [fwhm_positions, fwhm_values] = fwhm(x, positions)
tp = positions; //assign the peak position into tp
t_aux = 1;
while x(tp) < 2*x(tp + t_aux),
t_aux = t_aux + 1;
end;
fwhm_positions = (tp - t_aux):(tp + t_aux);
fwhm_values = x((tp - t_aux):(tp + t_aux));
endfunction;
t = 1:1000;
m = 350;
s = 180;
x = exp(-(1/(2*s))*(t - m).^2); // 'x' is a gaussian function
plot(t, x);
plot(fwhm_positions, fwhm_values, 'r.-');
Now, look the result following.
Thanks CV, you helped us too much!
God bless you.
Marcadores:
functions,
FWHM,
signal processing,
simulation
Subscribe to:
Posts (Atom)