So, I ask for you explain better what you want.
Stanley, I think the meshgrid() function can help you, like following:
N = 20;
x_range = -1:2/(N - 1):1;
y_range = -1:1.2/(N - 1):0.2;
[x y] = meshgrid(x_range, y_range);
P = [];
for i1 = 1:N,
for i2 = 1:N,
P(i2,i1) = color_P(i1, i2); //here you put the function P = f(x, y)
end;
end;
---------------
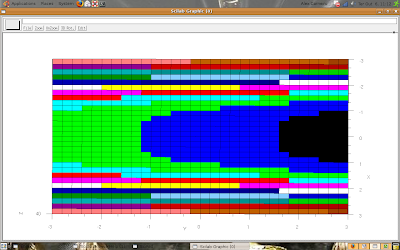
For plot the graph, you can use the fplot3d1(.) function. The following picture shows a example:
deff('z=f(x,y)','z=x^4-y')
x=-3:0.2:3 ;y=x ;
fplot3d1(x, y, f, alpha = 0, theta = 0); // alpha and theta are the rotation angles
The result is:

Now, you study the fplot3d1(.) function for make your own graph.
The presented function plots graphs as surfaces if you change the variables alpha and theta (try alpha = 5 and theta = 30).
That's all.
No comments:
Post a Comment