Ok, I'd not write about properties of figures but the reader's satisfaction is more important.
We can manipulate any property of the graphs in Scilab as following:
--> set("figure_style","new"); //create a figure in entity mode
-->f = get("current_figure")
f =
Handle of type "Figure" with properties:
========================================
children: "Axes"
figure_style = "new"
figure_position = [655,473]
figure_size = [610,461]
axes_size = [596,397]
auto_resize = "on"
figure_name = "Scilab Graphic (%d)"
figure_id = 0
color_map= matrix 32x3
pixmap = "off"
pixel_drawing_mode = "copy"
immediate_drawing = "on"
background = -2
visible = "on"
rotation_style = "unary"
user_data = []
--> a = f.children // the handle on the Axes child
Now, let's set the desired color:
--> a.foreground = 5;
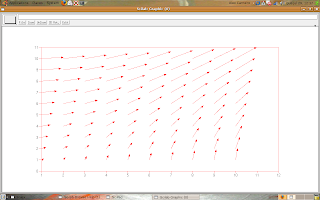
And we can make the graph:
--> x = [1:10]';
--> y = [1:10]';
--> [vx vy] = meshgrid(x, y);
--> champ(x, y, vx, vy, 1);
The result is:

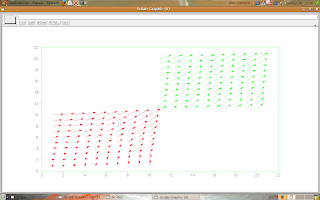
But, we want more! Let's continue the script as following:
--> a.foreground = 3;
--> x = 10 + [1:10]';
--> y = 10 + [1:10]';
--> [vx vy] = meshgrid(x, y);
--> champ(x, y, vx, vy, 1);
The result is:

The foreground element, called in
--> a.foreground = n; // n is a number that represents the desired color
may be any of these values:
- 1 - black
- 2 - blue
- 3 - green
- 4 - cyan
- 5 - red
- 6 - magenta
- 7 - yellow
- 8 - white
- 9 - dark blue
Scilab can make graphs with more colors (for the numbers higher or equal than 10), but you are smart for test it.
If you want a black bound (look that the made graphs, the bound's color is the same of the vectors) you have to put the command
--> a.foreground = 1;
after the champ(.) function:
That's all, now the unknown reader can plot vectors with colors.
2 comments:
Hello,
As to this topic, is it possible to make color vectors as in matlab in scilab?
I mean doing like:
color='rgb'
then using it in plot:
plot(x,y,color(1));
to get graph color as 1 from color vector, which is red.
Maybe, if you use plot2d you can change the color with color(r,g,b), e.g. plot2d(x,sin(x),color(255,0,0)),
but I don know how to do it with single points.
Post a Comment